What has caused taxes to increase in the UK? (The backdrop)
The UK’s tax burden has been rising steadily, a pattern mirrored in many developed economies including the US, Japan, Italy and France. Persistent budget deficits have become the norm rather than a temporary response to crises.
This structural imbalance reflects three long-term challenges: an ageing population, ongoing demand for public services such as healthcare and pensions, and a lack of sustained productivity growth. Together, these trends limit fiscal flexibility and imply continued upward pressure on taxation.
For investors and savers, understanding this dynamic is vital. Sound financial planning can help offset some of the pressures from rising taxes and protect wealth over the long term.
How much have UK taxes increased?
Many working people sense that the tax burden has increased and the data confirms it. According to the Office for Budget Responsibility (OBR), UK tax receipts are at multi-decade highs and are forecast to climb further through the late 2020s (Chart 1).
Chart 1: UK tax receipts as a % of GDP (2001A-2029F)
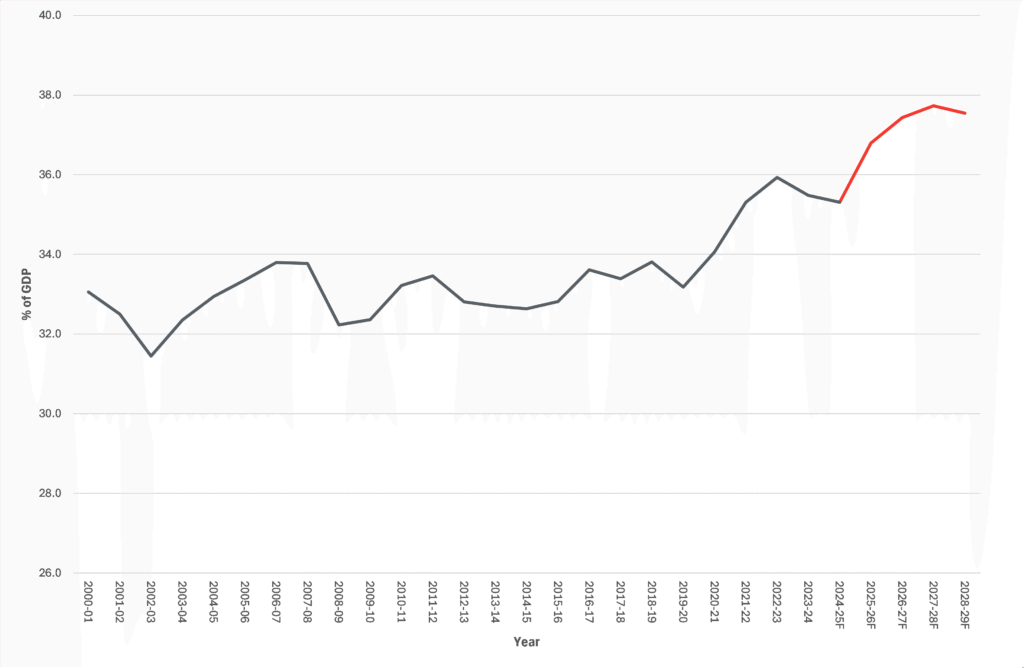
Source: OBR March 2025 Economic and Fiscal Outlook, actual data till Apr-24, OBR forecasts Apr-25-29.
The total tax received by the government is currently more than a third of the UK’s Gross Domestic Product (GDP), which is the total value of all goods and services supplied by this country. If the UK was a company, GDP would be similar to its annual revenue.
Two main forces are driving this: fiscal drag and policy change.
Fiscal drag occurs when inflation and wage growth push more income into higher tax bands while allowances remain frozen; a “stealth tax” that quietly reduces real disposable income.
Policy change has also contributed: higher income tax rates, increased taxation on dividends, capital gains and corporate profits, and a past rise in VAT.
Further changes are already in motion, including adjustments to employer National Insurance contributions and proposed reforms to pension inheritance tax rules.
While the OBR’s forecasts are respected, its GDP projections have at times proved optimistic, meaning future tax receipts may disappoint if growth underperforms, reinforcing the deficit challenge. Attention is focused on the Chancellors next budget, expected 26th November.
What is the UK’s spending deficit? (The fiscal gap)
The UK last ran a budget surplus in 2000/01. For nearly a quarter of a century, spending has exceeded revenue (Chart 2).
Chart 2: UK government annual budget surplus / (deficit) % of UK GDP, 2001-2030F
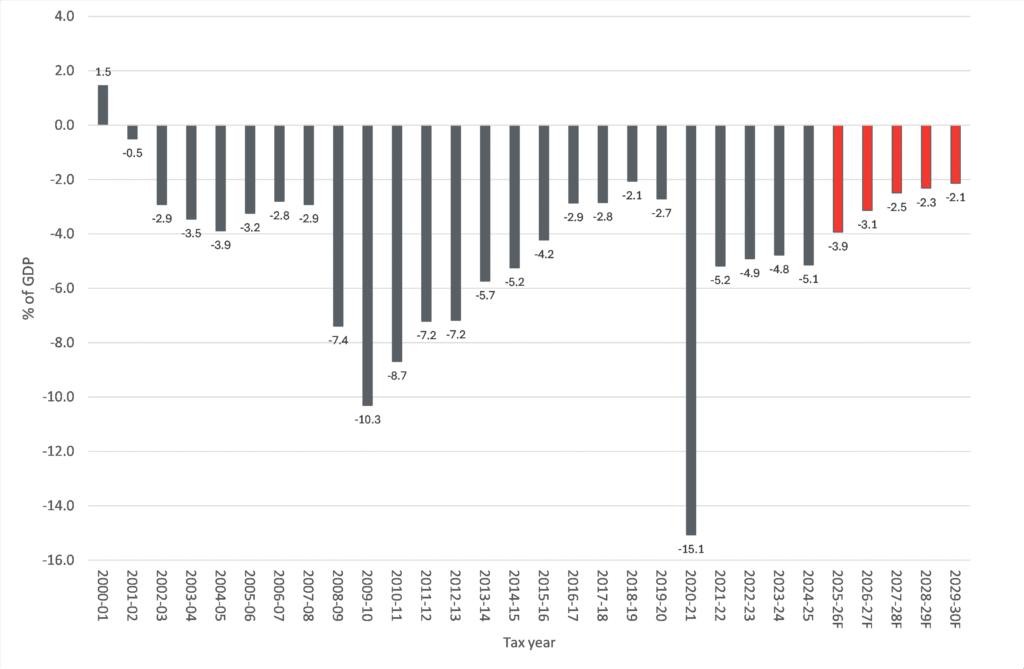
Source: OBR, https://obr.uk/data/
In 2024–25, the government recorded a budget deficit equivalent to roughly 5% of GDP, about £149 billion, or more than £2,000 per person.
Deficits of this scale are financed through borrowing, mainly via the issuance of government bonds (“gilts”) sold to institutional investors such as pension funds, insurers and, at times, the Bank of England. In recent years, the UK has depended increasingly on the willingness of these investors, sometimes called “bond vigilantes”, to keep funding shortfalls at sustainable rates.
Demographics are a core driver of this imbalance. Longer life expectancy and lower birth rates mean a growing share of the population is retired, which means the government is having to spend more on things like state pensions, health and social care. At the same time, calls for higher public investment persist, so policy makers are reluctant to reduce spending in other areas too. These structural realities suggest deficits will persist unless significant policy reform occurs.
What is the UK’s debt to GDP ratio? (The weight of the nation)
Recurring deficits have lifted public debt sharply. UK government net debt has risen from around 28% of GDP in 2001 to roughly 90% in 2024 (Chart 3).
Chart 3: UK government net debt/GDP (2001A-2030F)
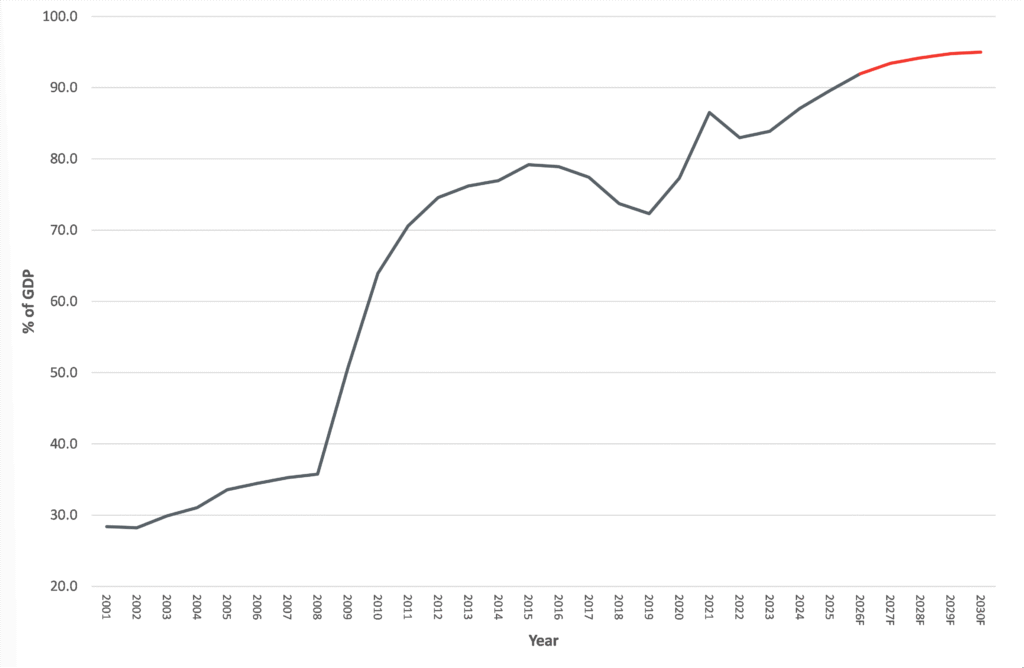
Source: OBR, https://obr.uk/data/, March 2025 Economic and Fiscal Outlook
Debt servicing costs now exceed the annual defence budget. The OBR expects debt to continue climbing gradually over the remainder of the decade. Without corrective action, its long-term modelling suggests the debt ratio could rise to around 270% of GDP by 2070.
In practice, this means future governments face a trilemma:
1. Raise more revenue through taxation;
2. Cut spending on public services; or
3. Accept rising debt levels and higher borrowing costs.
Higher taxation appears the most politically feasible, and thus the most likely.
Who will pay the biggest price of government tax policy? (Fiscal tipping points)
The traditional “social contract” between taxpayers and the state is under pressure. Weak productivity growth since the Global Financial Crisis, coupled with persistent inflation and a cost-of-living squeeze, has heightened public frustration.
With limited room for spending cuts, policymakers may increasingly target wealth and estate taxation, arguably politically easier to justify than raising taxes on income or consumption. Recent changes to “non-dom” rules and pension inheritance tax illustrate this shift.
For high earners, business owners and property holders, this suggests a future of rising complexity and potentially higher effective tax rates.
What impact will UK debt and taxation have on investors?
From an investment perspective, a sustained rise in public debt raises questions about the traditional assumption that government bonds are “risk-free.” However, higher yields on gilts and investment-grade bonds, particularly those with short periods to maturity, now offer better long-term value than during the majority of the 2010’s, when interest rates were near zero. Add in the ‘spread[1]’ available for savers buying UK investment grade bonds, and the ‘all-in’ return can be viewed as more interesting.
Investors who understand how a government’s spending policy interacts with bond markets can use these dynamics to their advantage by balancing portfolios with assets that benefit from inflation, different levels of income, and prudent tax efficiency. Those searching for more details on the UK market as an investment class, should refer to our upcoming report ‘Home comfort or hidden cost’.
[1] The ‘spread’ is the gap between what corporate bonds pay in interest as a percentage of value and the corresponding government issuer. It is a measure of risk.
Conclusions
While precise forecasting is impossible, the direction of travel is clear: the UK faces persistent fiscal strain, and taxation will likely remain on an upward path.
For individuals and families with significant assets, particularly those with estates above the inheritance tax nil-rate band, proactive financial planning is essential. Thoughtful structuring of investments, pensions and estates can help manage tax exposure legally and responsibly.
At Morenti Wealth, we believe that informed, evidence-based advice, delivered at a reasonable and transparent cost, helps clients navigate this environment with clarity and confidence. To speak to me or one of our expert team, simply visit the Contact Us section of this website or email hello@morentiwealth.co.uk.
About Morenti Wealth Partners
Morenti Wealth is a trading style of Burgess & Lee Ltd, an independent financial advice firm specialising in retirement and inheritance tax planning. Morenti Wealth focuses on delivering clear, actionable strategies tailored to clients’ unique goals, stripping away unnecessary complexity and costs. Burgess & Lee is authorised and regulated by the Financial Conduct Authority (FCA).
Disclaimer
This report is for information only and does not constitute personal financial advice. We strive to provide accurate and up-to-date information, but investments carry risks, including the potential loss of capital. This article does not consider your individual circumstances. You should seek personalised advice before making financial decisions.